S-Parameter Viewer & RF Synthesis Tools
Introduction
This is a comprehensive toolkit for RF and microwave circuit design. It combines S-parameter visualization capabilities with synthesis tools for filters, matching networks, attenuators, and power combiners. Additionally, a number of simple RF engineering calculators are available in the menu bar at the top of the window.
Features
Data Display
The tool can display S-parameter data in various formats, including polar plots and Smith charts. Data markers are supported in each display widget. Additionally, the magnitude display supports limit lines.
Data Management
This tool can read data from Touchstone files and Qucs-S datasets. Users can easily manage files and traces using the data tabs to add and remove data. Sessions can be saved into a file for later use.
Design Tools
The tool includes built-in design tools such as:
Interface Overview
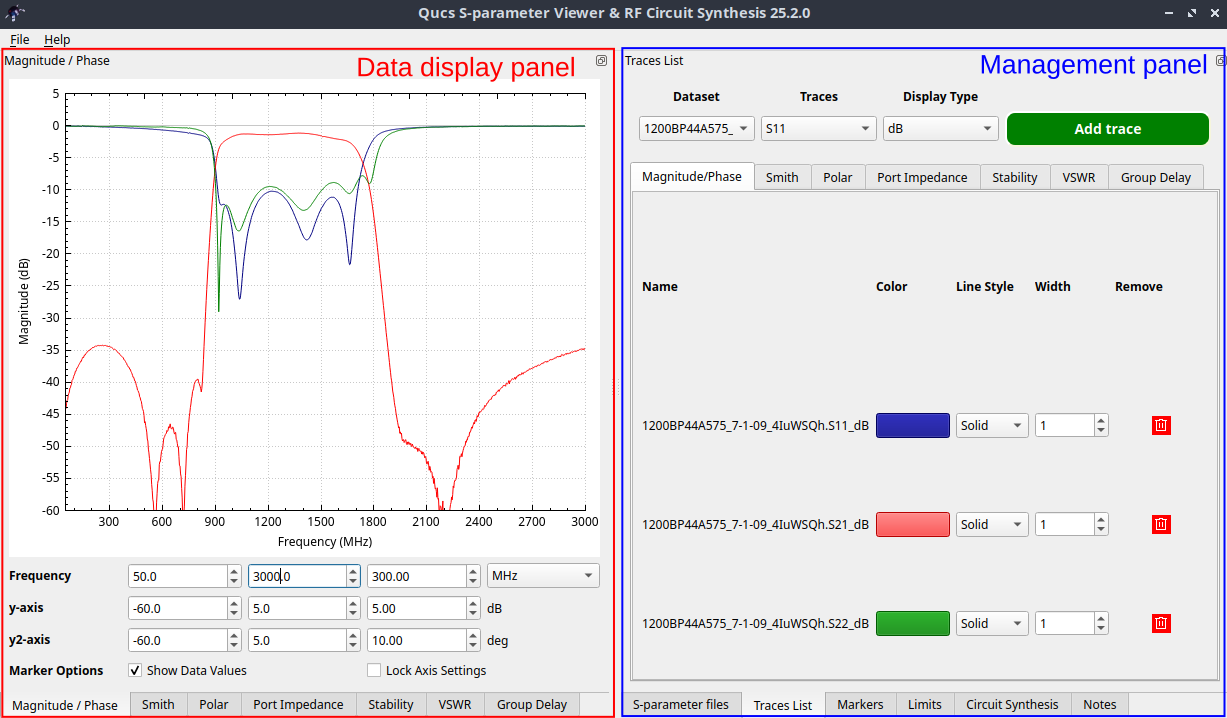
Overview of the user interface.
The tool interface consists of three main components:
Data Display Panel
Contains the display widgets for visualizing the data. Learn more
Data Management Panel
Provides widgets for managing and analyzing data:
- Marker display
- Limit management
- Synthesis tools
- Note-taking widget