Data management panel
File management
It contains the list of the S-parameter files whose data is available in the current session. The files can be added either by dragging and dropping files over the file list or using the “Add file” button on the bottom of the panel
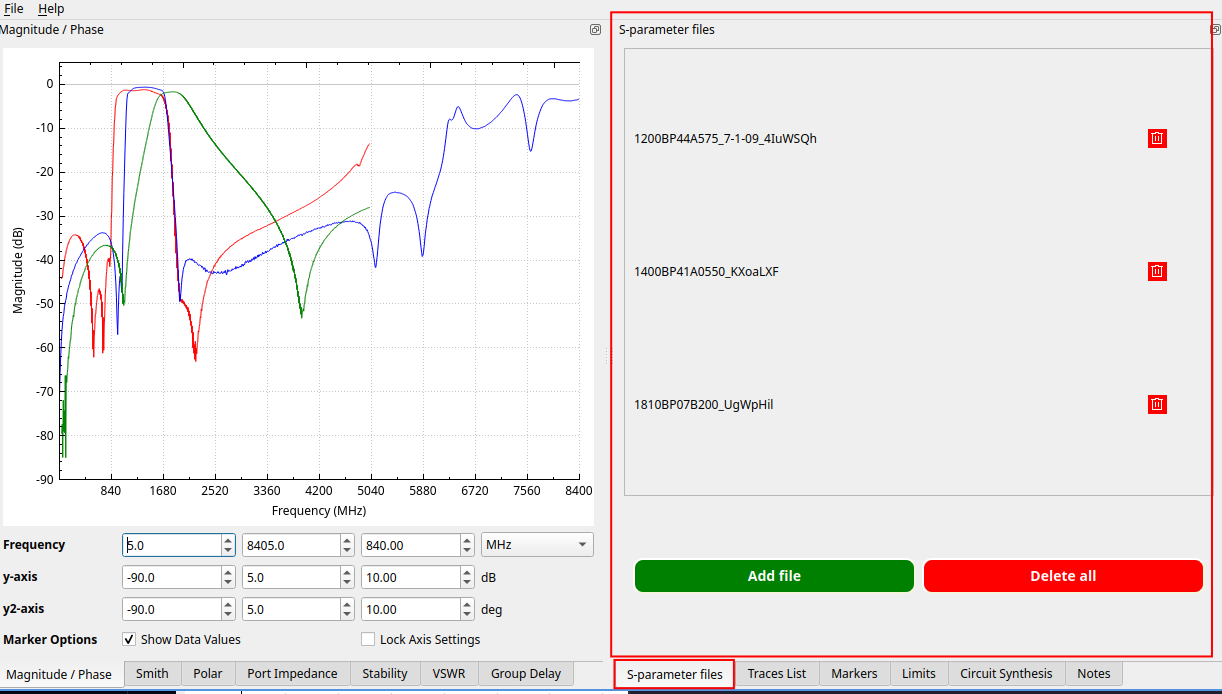
S-parameter file list
Trace management
This panel contains all the traces displayed on the data plot widgets. The traces are sorted by display type (magnitude, polar, Smith chart, etc.). The trace style settings are arranged in a tabular format for easy access.
The traces can be added using the widgets on the top by selecting the available traces for each dataset and the type of the plot.
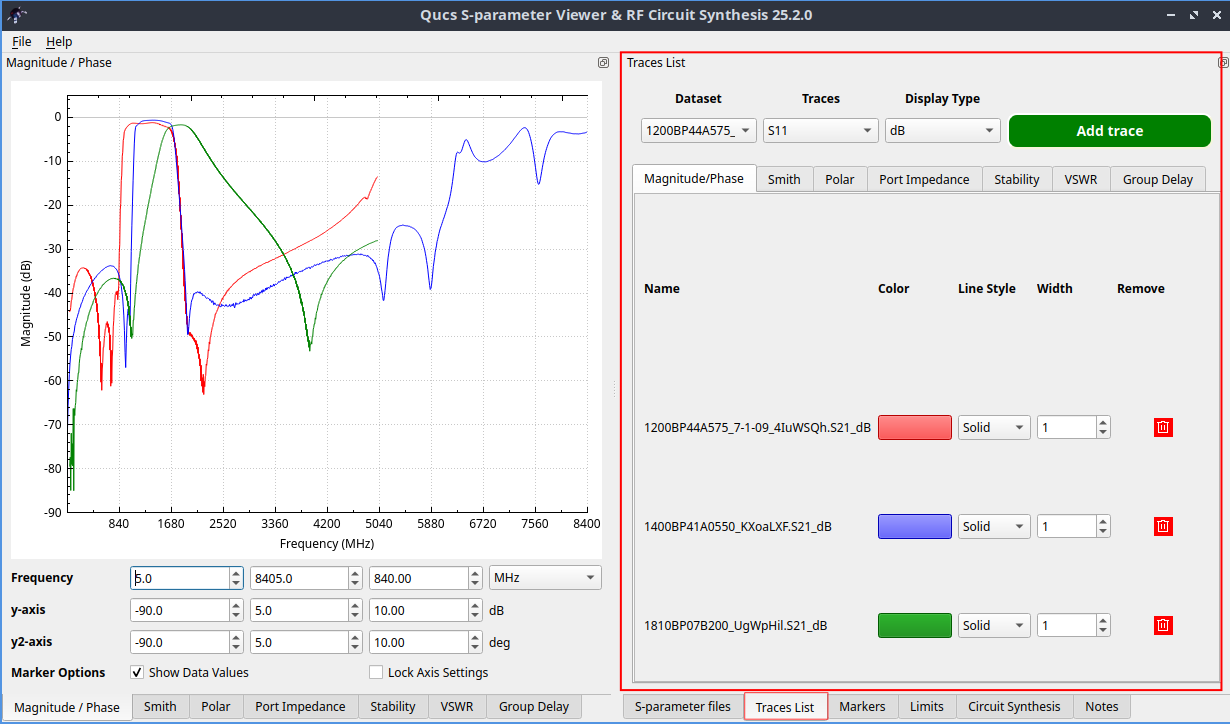
Trace management widget
Markers
The marker panel allows the user to create vertical markers for all the traces in the display panel. The markers are created by pressing the green button on the top and adjusting their frequency in the table panel below. The markers are placed for all the data display widgets at once and the marker data is shown in the bottom side of the panel.
The markers can be removed either by using the individual remove buttons for each marker or all in a row using the red button on the top.
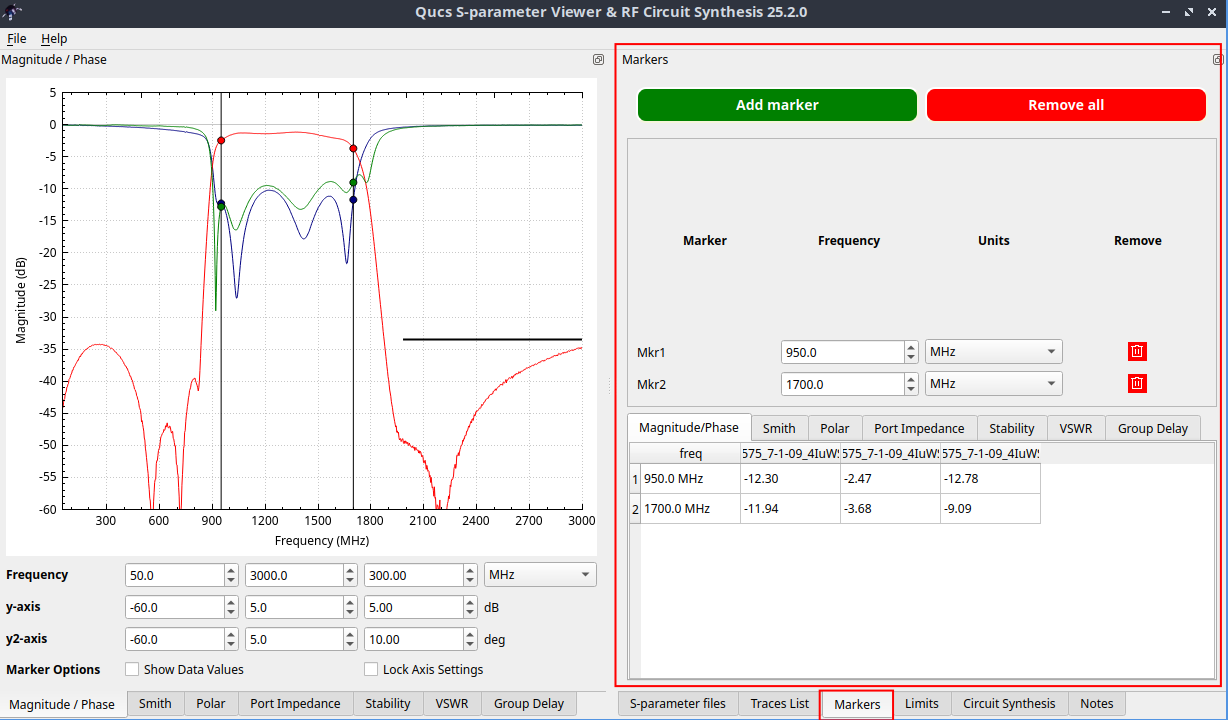
Marker management widget
Limits
It allows the user to define a number of trace limit lines in the magnitude/phase plot widget. This functionality does not work for the other data display tools. The limits are added using the green button in the top side of the panel and the limits can be removed all individually or all in a row using the red button on the top.
The limits lines are defined by the following parameters:
Start and stop frequencies
Y-axis start and stop values. These values are coupled by default, but they can also be set individually by toggling the central button:
“<—>”: Couple start and end values
“<-X->”: Uncouple start and end values
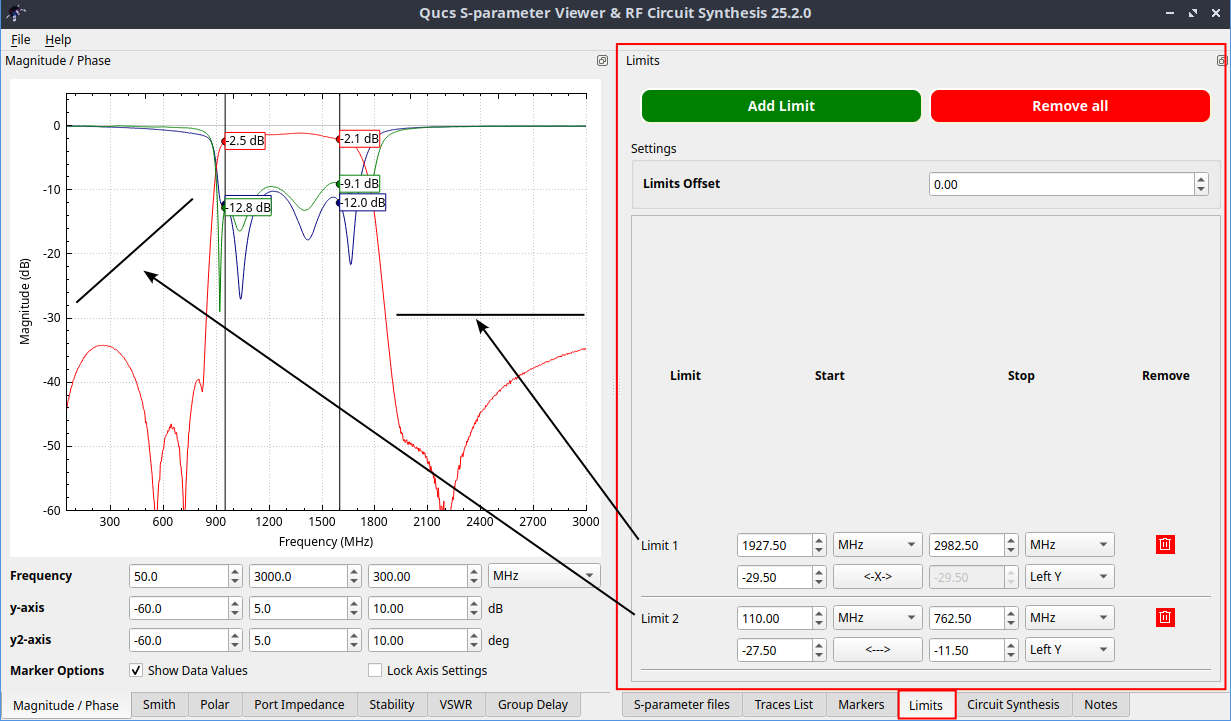
Limit management widget
RF circuit synthesis tools
This panel contains tools to synthesize the schematic of different RF blocks based on their design parameters. It also includes a netlisting tool for tweaking the synthesized network parameters and a tab for adjusting the simulation settings.
The simulation is run internally, no external simulation kernels are needed.
On the bottom, the panel has a schematic viewer and export options for simulating the circuit in an external EDA software. Ccurrently, only Qucs-S format is supported.
Note-taking tool
The note-taking widget is a simple plain text editor for writing annotations about the data. The notes are saved with the viewer session so they can be loaded later.
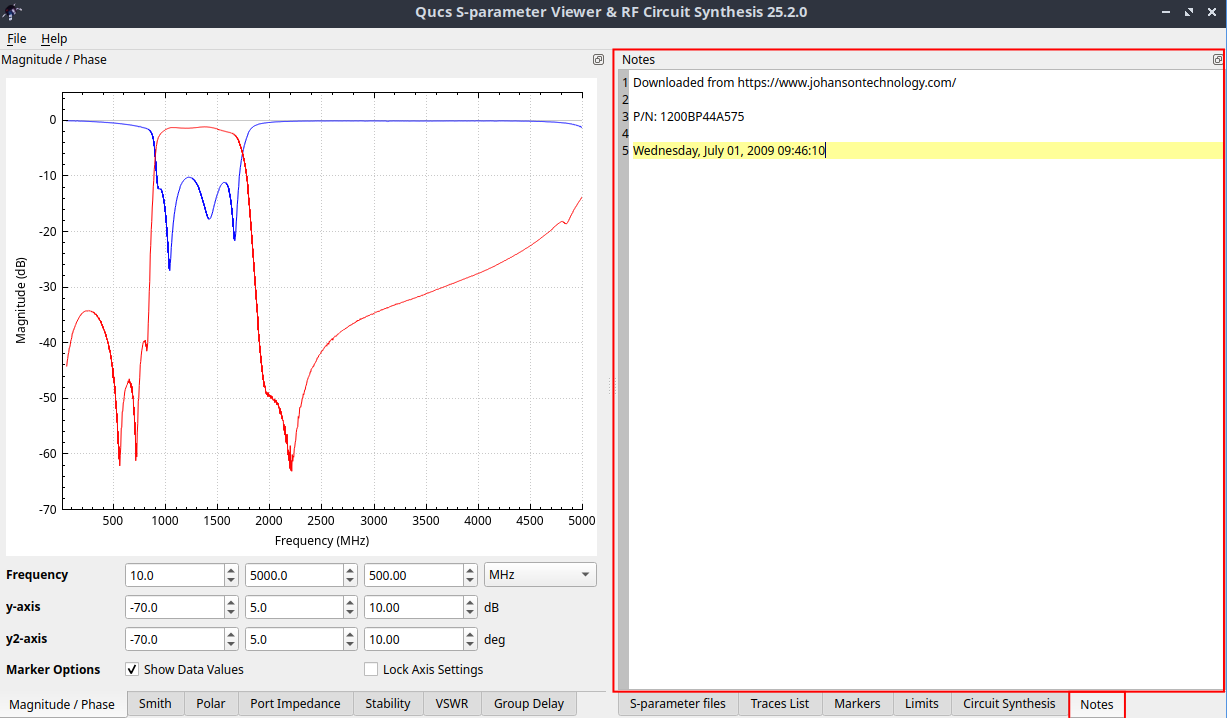
Note taking widget